Cholesterol Ratio Calculator
Free Cholesterol Ratio Calculator: instantly calculate your Total/HDL, LDL/HDL, and Triglycerides/HDL ratios in mg/dL or mmol/L. Includes color-coded risk...
Formula used
How to Use the Cholesterol Ratio Calculator
Enter your four lipid panel values — Total Cholesterol, HDL (high-density lipoprotein), LDL (low-density lipoprotein), and Triglycerides — from your most recent blood test. Select whether your values are in mg/dL (used in the United States) or mmol/L (used internationally), then click Calculate Ratios. The tool instantly computes all three clinically important cholesterol ratios and classifies your cardiovascular risk level based on established NCEP ATP III and American Heart Association (AHA) thresholds.
Before using this tool, locate your lipid panel results from a recent laboratory report. Values should come from a fasting lipid panel (10–12 hours without food) for the most accurate results, as this is the standard clinical measurement method. If you only have some values, you can still calculate the Total/HDL ratio — the most commonly used risk indicator — using just Total Cholesterol and HDL.
Step-by-Step Instructions
- Enter Total Cholesterol — your combined cholesterol value (HDL + LDL + 20% of triglycerides) in mg/dL or mmol/L.
- Enter HDL Cholesterol — the "good" cholesterol that removes LDL from the bloodstream. Low HDL increases cardiovascular risk.
- Enter LDL Cholesterol — the "bad" cholesterol that deposits in arterial walls. Usually calculated indirectly via the Friedewald equation.
- Enter Triglycerides — blood fat levels linked to insulin resistance, metabolic syndrome, and cardiovascular disease.
- Select your unit — choose mg/dL if your report is from a US lab, or mmol/L for international format.
- Read your results — see all three ratios with color-coded risk classification and specific clinical guidance.
The Three Cholesterol Ratios Explained
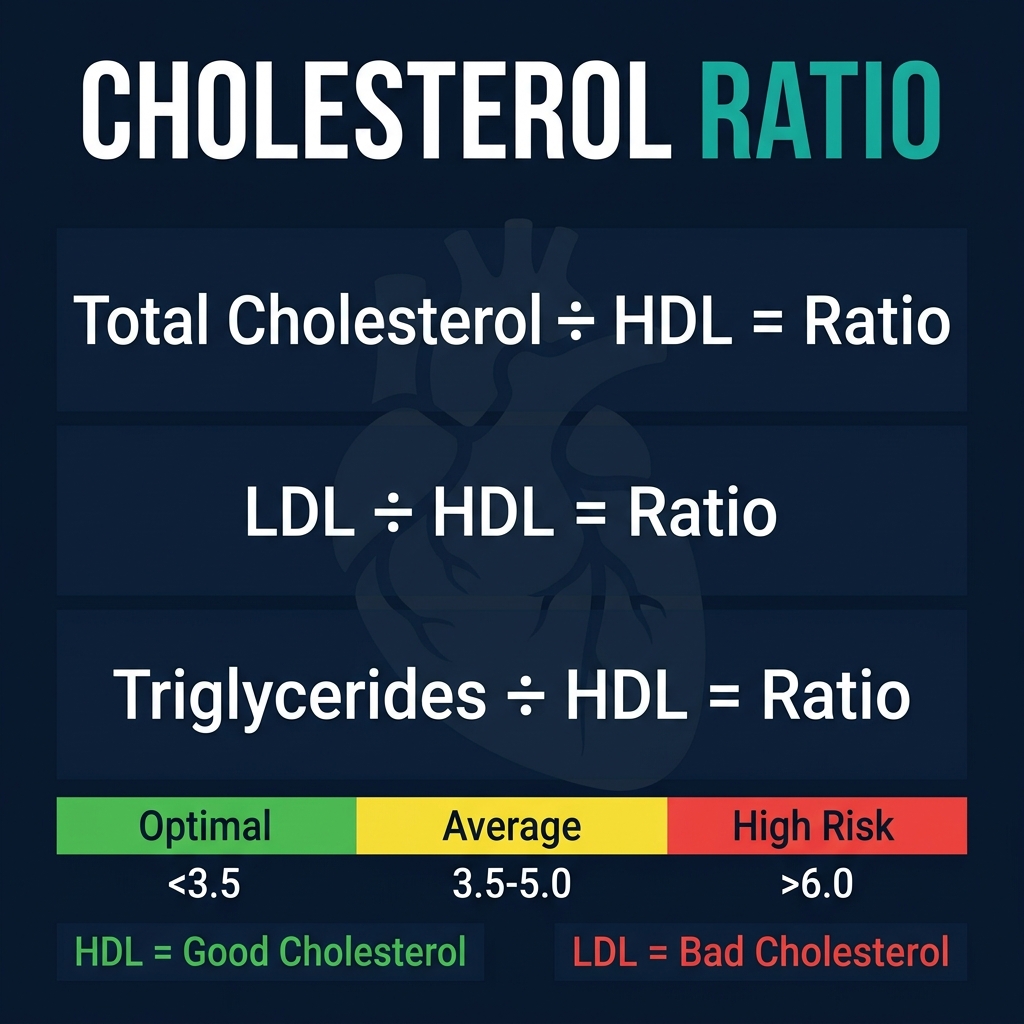
Cholesterol ratios are calculated from your standard lipid panel and provide a more nuanced cardiovascular risk assessment than any single cholesterol value alone. The three primary ratios used in clinical practice are:
1. Total Cholesterol / HDL Ratio (The Primary Cardiac Risk Ratio)
The Total/HDL ratio — also called the "cholesterol ratio" or "atherogenic index" — is the most widely used single-number cardiovascular risk indicator. It was validated in the Framingham Heart Study and is the primary ratio reported by most clinical lipid guidelines. A lower ratio is always better, as it means your HDL is protecting a larger proportion of your total cholesterol load.
- Optimal (Below 3.5): Strong cardiovascular protection. Associated with very low 10-year CVD event risk in major prospective studies. Seen in regular exercisers with healthy HDL levels.
- Average Risk (3.5–5.0): The average for most adults in Western populations. Not alarming, but improvement is beneficial through diet and exercise.
- Above Average Risk (5.0–6.0): Elevated cardiovascular risk. Warrants lifestyle intervention and possibly medical review.
- High Risk (Above 6.0): Significantly elevated cardiovascular risk. Clinical intervention typically recommended. May warrant statin therapy evaluation by a physician.
For reference, the average American has a Total/HDL ratio of approximately 4.5 for men and 4.0 for women. The AHA considers a ratio below 5 acceptable and below 3.5 optimal.
2. LDL / HDL Ratio (The Atherogenicity Ratio)
The LDL/HDL ratio directly measures the balance between cardiovascular risk (LDL) and protection (HDL). High LDL deposits plaque in arteries; high HDL scavenges and removes it. This ratio — sometimes called the "atherogenic ratio" — is particularly useful for monitoring the effectiveness of cholesterol-lowering interventions, as both statin therapy and lifestyle changes affect LDL and HDL in measurable ways.
- Optimal (Below 1.5): Strong cardioprotective profile. LDL is well-managed relative to HDL capacity.
- Near Optimal (1.5–2.5): Acceptable range for most healthy adults without other cardiovascular risk factors.
- Borderline High (2.5–3.5): Warrants dietary improvement and monitoring. Consider LDL reduction strategies.
- High Risk (Above 3.5): Significantly unfavorable balance. Associated with accelerated atherosclerosis risk.
3. Triglycerides / HDL Ratio (The Insulin Resistance Marker)
The Triglycerides/HDL ratio has gained clinical attention as a proxy for insulin resistance and metabolic syndrome. Research published in the Journal of the American Medical Association and the American Journal of Cardiology has identified this ratio as a stronger predictor of heart attack risk in some populations than the traditional Total/HDL ratio. High triglycerides with low HDL is the classic lipid profile of metabolic syndrome — a cluster of conditions that includes central obesity, high blood pressure, and elevated fasting glucose.
- Optimal (Below 1.5 mg/dL ratio, or Below 0.87 mmol/L ratio): Excellent insulin sensitivity indicator. Associated with cardiovascular protection in US-based studies.
- Average (1.5–2.5 mg/dL): Moderate insulin sensitivity. Monitor with dietary habits.
- Elevated (2.5–4.0 mg/dL): Possible insulin resistance. Consider dietary and lifestyle review.
- High (Above 4.0 mg/dL): Strong indicator of metabolic dysfunction. Clinical assessment recommended.
Note: The Triglycerides/HDL ratio thresholds differ by unit system. In mg/dL (US standard), a ratio above 3 in Caucasian populations is associated with a 3-fold increased risk of heart attack. This threshold may differ for Asian populations, in whom metabolic syndrome occurs at lower body weight.
The Science Behind Cholesterol Ratios
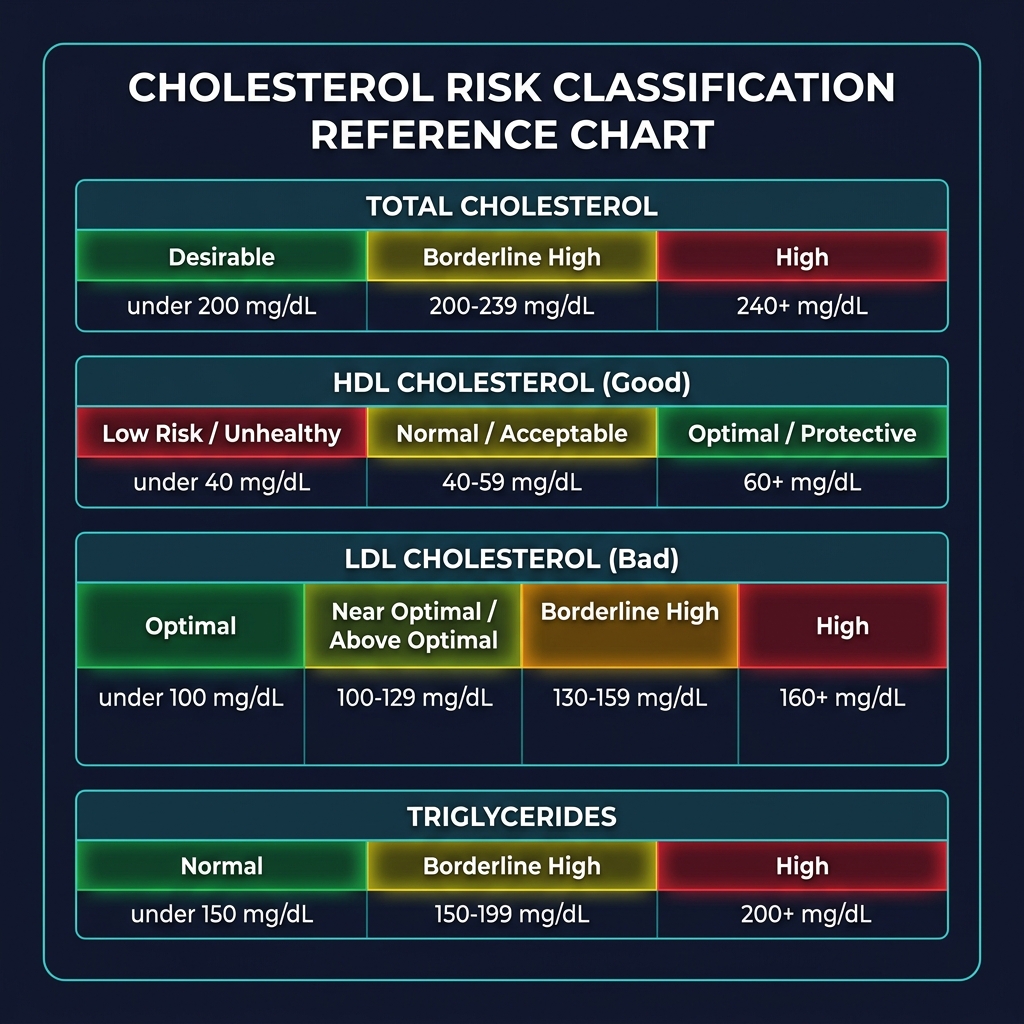
Cholesterol is transported in the bloodstream packaged in lipoprotein complexes — particles with protein on the outside and lipid (fat) on the inside. Different lipoprotein types carry cholesterol to different destinations:
- LDL (Low-Density Lipoprotein): Transports cholesterol from the liver to peripheral tissues. When LDL particles are abundant, excess cholesterol deposits in arterial walls, forming atherosclerotic plaques. Small, dense LDL particles are particularly atherogenic (plaque-forming). This is why LDL is called "bad cholesterol."
- HDL (High-Density Lipoprotein): Performs "reverse cholesterol transport" — collecting cholesterol from arterial walls and peripheral tissues and returning it to the liver for excretion. Higher HDL is consistently associated with reduced cardiovascular risk in population studies. HDL also has anti-inflammatory and anti-oxidant properties. This is why HDL is called "good cholesterol."
- VLDL (Very Low-Density Lipoprotein): Carries triglycerides from the liver to peripheral tissues. VLDL is estimated as triglycerides ÷ 5 in the Friedewald equation. High VLDL reflects elevated triglyceride load — associated with fat accumulation and insulin resistance.
- Triglycerides: The storage form of dietary fat. Elevated triglycerides after fasting indicate excess caloric intake (especially from refined carbohydrates and alcohol), insulin resistance, hypothyroidism, kidney disease, or genetic hyperlipidemias.
Why Ratios Matter More Than Absolute Values
A Total Cholesterol of 220 mg/dL sounds elevated — but if that person's HDL is 90 mg/dL, their Total/HDL ratio is just 2.4 (excellent). Conversely, a Total Cholesterol of 180 mg/dL paired with an HDL of 30 mg/dL gives a ratio of 6.0 — a significantly higher cardiovascular risk. This is why cholesterol ratios are consistently endorsed by major cardiovascular guidelines over single cholesterol values for risk stratification.
The most powerful evidence comes from the Lipid Research Clinics (LRC) Study, the Helsinki Heart Study, and the VA-HIT trial, all of which demonstrated that the Total/HDL ratio predicted cardiovascular events more accurately than LDL or Total Cholesterol alone. The European Heart Score and Framingham Risk Score both incorporate HDL-related calculations.
How to Improve Your Cholesterol Ratios
Cholesterol ratios respond well to targeted lifestyle interventions. Medical evidence consistently supports the following approaches:
Increase HDL ("Good Cholesterol")
- Aerobic exercise: The most powerful lifestyle intervention for raising HDL. 150+ minutes of moderate-intensity aerobic exercise per week (brisk walking, cycling, swimming) raises HDL by 5–10% on average. High-intensity interval training (HIIT) may double this effect.
- Quit smoking: Smoking actively suppresses HDL. Cessation raises HDL by 4 mg/dL on average within weeks.
- Moderate alcohol consumption: 1 drink/day for women, 1–2 for men modestly raises HDL (~4 mg/dL). However, excess alcohol raises triglycerides and overall health risk — this is not a recommendation to start drinking.
- Healthy fats: Replace saturated fat with monounsaturated fat (olive oil, avocados, nuts) to improve the LDL/HDL ratio without dramatically raising total LDL.
- Omega-3 fatty acids: Fish oil supplements (2–4g/day of EPA+DHA) substantially lower triglycerides (by 25–50%) and modestly raise HDL, improving the Triglycerides/HDL ratio significantly.
Reduce LDL ("Bad Cholesterol")
- Reduce saturated fat: Trans fats and saturated fats (found in red meat, full-fat dairy, processed foods) increase LDL and lower HDL. Reducing saturated fat to
- Add soluble fiber: Oats, psyllium husk, beans, and barley reduce LDL by binding cholesterol in the gut. 10–25g of soluble fiber daily can lower LDL by 10–15%.
- Plant sterols/stanols: Found in fortified foods (yogurt, margarine) and some nuts. 2g/day of plant sterols reduces LDL by 10–15% by competing with dietary cholesterol absorption.
- Statin medications: For individuals with high cardiovascular risk or familial hypercholesterolemia, statins (atorvastatin, rosuvastatin, etc.) reduce LDL by 30–60% and significantly improve all three ratios.
Reduce Triglycerides
- Cut refined carbohydrates and added sugar: The most effective dietary intervention. High-glycemic foods (white bread, soda, candy) dramatically spike triglycerides in susceptible individuals.
- Limit alcohol: Even moderate alcohol substantially elevates triglycerides in some people.
- Lose excess weight: Even modest weight loss (5–10% of body weight) significantly reduces triglycerides. Use our Calorie Deficit Calculator to plan a structured weight loss approach.
- Increase physical activity: Exercise improves insulin sensitivity, which reduces both fasting glucose and triglyceride levels. Track your energy balance with our Maintenance Calorie Calculator.
Understanding Your Results in Context
Cholesterol ratios should always be interpreted alongside other cardiovascular risk factors. No single number tells the complete story. The following factors modify your cardiovascular risk independent of cholesterol ratios:
- Age and sex: Cardiovascular risk increases substantially with age. Men over 45 and women over 55 face higher baseline risk. Use our Age Calculator to confirm your exact age for risk frameworks.
- Blood pressure: Hypertension multiplies cardiovascular risk. The combination of high blood pressure and adverse cholesterol ratios is particularly dangerous.
- Blood glucose: Diabetes and prediabetes are major independent cardiovascular risk factors. Monitor with our Blood Sugar Converter tool.
- BMI and body composition: Visceral adiposity (central obesity) is directly linked to adverse lipid profiles — high triglycerides, low HDL, and small dense LDL. Check your BMI Calculator and Body Fat Calculator.
- Family history: Familial hypercholesterolemia (FH) affects 1 in 250 people and causes extremely high LDL from birth, unresponsive to diet alone. FH requires medical management.
- Smoking: Directly damages arterial walls, lowers HDL, and promotes LDL oxidation — amplifying plaque formation at any cholesterol ratio.
If your ratios are elevated, consult your healthcare provider for a complete cardiovascular risk assessment, which may include hsCRP (high-sensitivity C-reactive protein), lipoprotein(a), coronary artery calcium (CAC) scoring, or formal 10-year cardiovascular risk calculation using established tools like the Pooled Cohort Equations.
Related Health Calculators
Cholesterol ratios are one piece of your complete cardiovascular health picture. Use these complementary tools for a comprehensive assessment:
- BMI Calculator — Body mass index correlates with lipid profiles; high BMI is associated with elevated triglycerides and reduced HDL
- Body Fat Calculator — Visceral fat directly drives adverse cholesterol ratios and insulin resistance more than subcutaneous fat
- Blood Sugar Converter — Insulin resistance and diabetes are strongly linked to high triglycerides and low HDL ratios
- Calorie Deficit Calculator — Moderate calorie restriction and weight loss improve all three cholesterol ratios significantly
- Maintenance Calorie Calculator — Understanding your TDEE is essential for dietary planning that improves lipid profiles
- Harris-Benedict Calculator — Basal metabolic rate calculation essential for customized cholesterol-lowering nutrition plans
- Ideal Weight Calculator — Reaching a healthy body weight is among the most effective interventions for improving cholesterol ratios