Blood Sugar Converter
Free blood sugar converter: instantly convert blood glucose levels between mg/dL (US standard) and mmol/L (international). Includes blood sugar range...
?????? ?????????
How to Use the Blood Sugar Converter
This tool converts blood glucose readings instantly between mg/dL (milligrams per deciliter — the standard in the United States) and mmol/L (millimoles per liter — used internationally, including the UK, Canada, Australia, and most of Europe). Enter your value, select the unit you are converting from, and the equivalent reading in the other unit appears immediately alongside a color-coded interpretation of your glucose level.
Before interpreting any blood glucose reading, make sure you know whether it comes from a fasting test (at least 8 hours without food), a post-meal test (1–2 hours after eating), a random test, or a continuous glucose monitor (CGM). The clinical thresholds differ significantly based on test type. For a broader metabolic health picture, combine this tool with our BMI Calculator and Maintenance Calorie Calculator.
Step-by-Step Instructions
- Enter your blood glucose reading — type the number from your glucometer, lab report, or CGM display.
- Select the unit — choose "mg/dL (US standard)" if your device shows whole numbers like 95 or 126, or "mmol/L (International)" if it shows decimals like 5.3 or 7.0.
- Read the result — the converter shows the equivalent value in the opposite unit, plus a color-coded range classification (Normal / Prediabetes / Diabetes / Low).
- Check the reference table — scroll down in the result panel to compare your reading against the official ADA and WHO diagnostic thresholds for both units.
Understanding mg/dL vs. mmol/L: Why Two Systems Exist
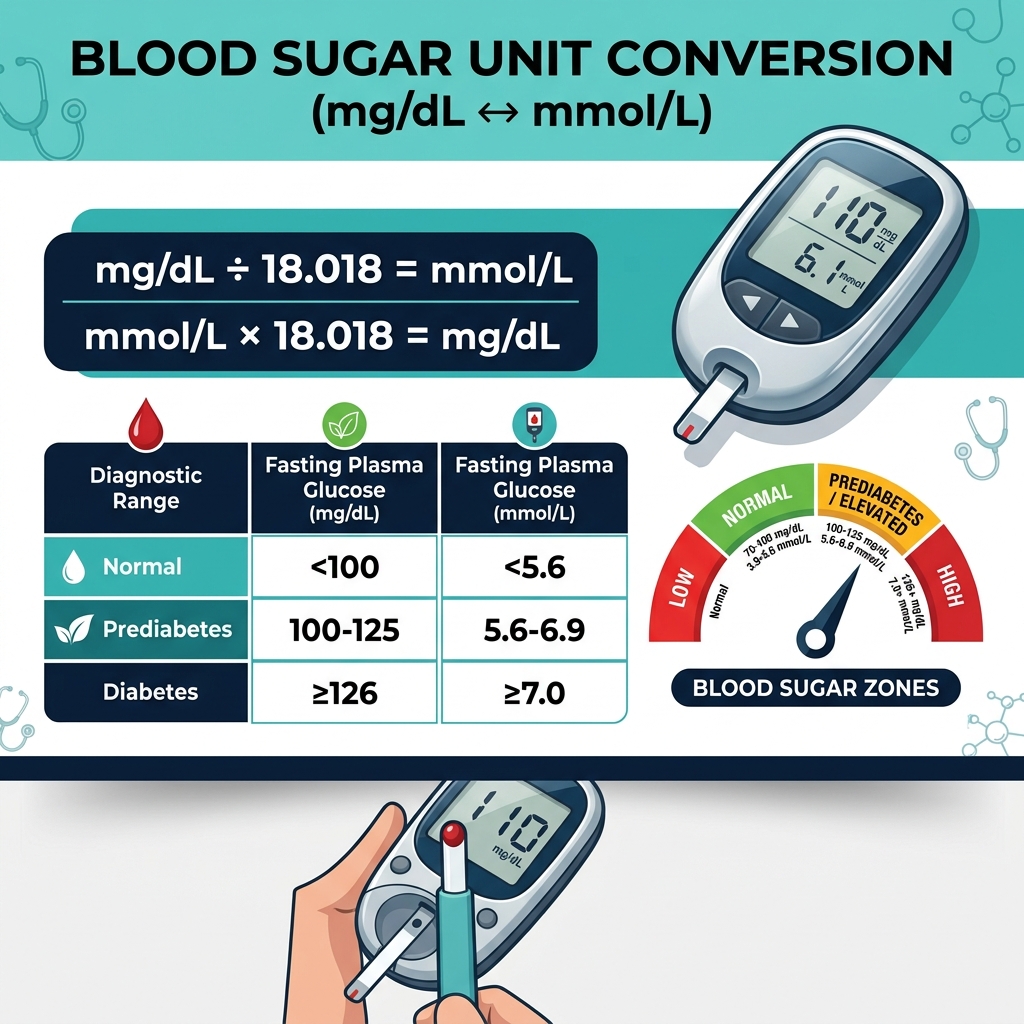
The two blood glucose measurement units arise from two different scientific traditions applied to clinical medicine:
- mg/dL (milligrams per deciliter) — expresses the mass of glucose in a fixed volume of blood. The United States exclusively uses this convention, so most American glucose meters, lab reports, and apps display mg/dL. Numbers in mg/dL are roughly 18× larger than their mmol/L equivalent, which can create confusion when reading international medical literature.
- mmol/L (millimoles per liter) — expresses glucose in molar concentration, relating to the number of glucose molecules in the solution. This is the SI (Système International) unit preferred by the WHO, the UK NHS, the European Association for the Study of Diabetes (EASD), and most countries outside North America.
The conversion factor between the two units is based on the molecular weight of glucose (C₆H₁₂O₆ = 180.18 g/mol), making the exact conversion: 1 mmol/L = 18.018 mg/dL. This calculator uses this precise molecular-weight-derived factor rather than the rounded 18.0 approximation, giving you medically accurate results.
Why Precision Matters in Blood Sugar Conversion
Using the rounded approximation of 18 instead of 18.018 introduces a small but measurable error — approximately 0.1% — which becomes clinically relevant at extreme values. At 400 mg/dL, the difference between 18.0 and 18.018 is 0.04 mmol/L. While this rarely affects clinical decisions, precision is especially important for insulin dosing calculations and research applications.
Blood Sugar Reference Ranges: What Your Numbers Mean
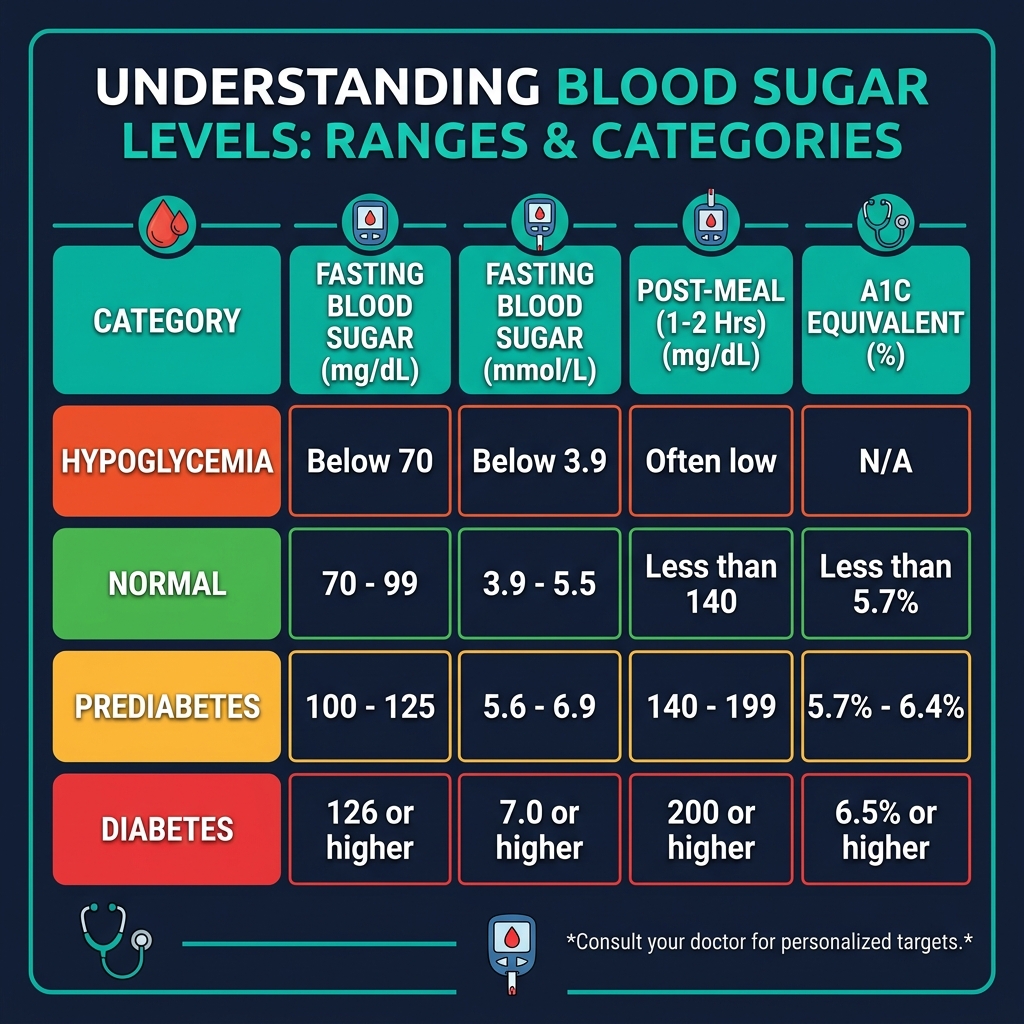
The American Diabetes Association (ADA) and World Health Organization (WHO) define these diagnostic thresholds. Note that thresholds differ by test type:
Fasting Blood Glucose (8+ hours without food)
Fasting glucose is the most standardized measurement, taken in a clinical setting after at least 8 hours without caloric intake. It is used for diabetes screening, diagnosis, and longitudinal monitoring.
- Hypoglycemia (Low): Below 70 mg/dL / 3.9 mmol/L — requires immediate treatment
- Normal: 70–99 mg/dL / 3.9–5.5 mmol/L — healthy glucose regulation
- Prediabetes (Impaired Fasting Glucose): 100–125 mg/dL / 5.6–6.9 mmol/L — insulin resistance developing
- Diabetes: 126 mg/dL or above / 7.0 mmol/L or above — on two separate occasions
Post-Meal Blood Glucose (1–2 Hours After Eating)
Postprandial glucose spikes are a key indicator of how well your body processes carbohydrates. The 2-hour post-meal test (oral glucose tolerance test, or OGTT) is used diagnostically.
- Normal 1-hour post-meal: Below 140 mg/dL / 7.8 mmol/L
- Normal 2-hour OGTT: Below 140 mg/dL / 7.8 mmol/L
- Prediabetes (Impaired Glucose Tolerance): 140–199 mg/dL / 7.8–11.0 mmol/L at 2 hours
- Diabetes: 200 mg/dL or above / 11.1 mmol/L or above at 2 hours
Random Blood Glucose (Any Time)
- Diabetes diagnosis: 200 mg/dL (11.1 mmol/L) or above with classic symptoms (polyuria, polydipsia, unexplained weight loss)
A1C Comparison Table
Glycated hemoglobin (HbA1c or A1C) reflects your average blood glucose over the previous 2–3 months. It is reported as a percentage in the US and most countries, and does not require conversion. Understanding how your in-the-moment glucose readings correlate to A1C is useful for long-term diabetes management. The pattern of readings tracked by our tool over time gives you data points that, when averaged, approximate your A1C trend. Track your metabolic health comprehensively with our Calorie Deficit Calculator and Harris-Benedict Calculator to understand how nutrition and metabolic rate interact with blood sugar control.
Factors That Affect Blood Glucose Readings
Blood glucose is highly dynamic and responds to dozens of physiological inputs. Understanding these factors helps you interpret your readings correctly rather than reacting to every number in isolation:
Diet and Macronutrient Composition
Carbohydrates exert the most direct and immediate effect on blood glucose. The glycemic index (GI) and glycemic load (GL) of foods describe how quickly and how much they raise blood glucose. Foods with high GI (white bread, white rice, sugary drinks) cause rapid spike-and-crash patterns. Low-GI foods (legumes, most vegetables, whole grains) produce gradual, sustained glucose responses.
- Simple carbohydrates (glucose, fructose, sucrose) absorb within 15–30 minutes of eating
- Complex carbohydrates (starch) absorb over 45–90 minutes
- Protein has minimal immediate impact on glucose but can stimulate modest glucagon release
- Fat slows gastric emptying, which delays — but also prolongs — glucose absorption from mixed meals
Optimizing caloric intake through a data-driven approach — as enabled by our Maintenance Calorie Calculator — helps stabilize blood glucose by preventing overeating and the accompanying insulin surges.
Physical Activity
Exercise has complex, context-dependent effects on blood glucose. Aerobic exercise (walking, cycling, swimming) generally lowers blood glucose by increasing insulin sensitivity and promoting glucose uptake by muscle cells. Resistance training can cause transient glucose increases during the session due to catecholamine release, followed by improved insulin sensitivity for 24–48 hours post-exercise.
Sleep and Cortisol
Sleep deprivation elevates cortisol, growth hormone, and glucagon — all of which drive blood glucose up. The "dawn phenomenon" (an early morning blood glucose rise between 4–8 AM) occurs even without eating due to cortisol and growth hormone surges preparing the body for waking activity. Poor sleep is independently associated with insulin resistance and a 2× increased risk of developing type 2 diabetes.
Stress
Psychological stress activates the hypothalamic-pituitary-adrenal axis, releasing cortisol and adrenalin that mobilize glucose from liver glycogen stores. Chronic stress — regardless of dietary habits — can cause persistently elevated fasting glucose. Stress management is therefore a genuine metabolic intervention.
Medications
Many common medications affect glucose readings: corticosteroids (significant hyperglycemia), thiazide diuretics (mild hyperglycemia), beta-blockers (mask hypoglycemia symptoms), fluoroquinolone antibiotics (dysglycemia), atypical antipsychotics (metabolic syndrome risk). Always discuss new medications with your healthcare provider in the context of glucose monitoring.
Blood Sugar Monitoring in Diabetes Management
For people living with diabetes, regular blood glucose monitoring provides the foundation for all clinical decisions. Understanding your readings in both mg/dL and mmol/L is important because:
- International travel — your glucometer may be calibrated to a different unit than local devices
- Reading international medical literature, dietary research, or CGM data from devices sold abroad
- Communicating with healthcare providers in different countries via telemedicine
- Understanding guideline recommendations — WHO and ADA publications often use different units
Continuous Glucose Monitors (CGMs)
CGMs (Dexcom, Libre, Medtronic Guardian) measure interstitial glucose (from the tissue fluid between cells) every 1–5 minutes, providing trend data that point-in-time fingerstick readings cannot. CGMs are typically calibrated in mg/dL in the US and mmol/L elsewhere, though most modern models can be toggled between units in settings. CGM data allows tracking of time in range (TIR) — the percentage of readings between 70–180 mg/dL (3.9–10.0 mmol/L), which the ADA recommends be above 70% for most adults with diabetes.
Target Blood Glucose Ranges for People with Diabetes
ADA 2024 Standards of Care recommend the following targets for most non-pregnant adults with diabetes:
- Before meals (fasting/preprandial): 80–130 mg/dL (4.4–7.2 mmol/L)
- 1–2 hours after meal start: Below 180 mg/dL (10.0 mmol/L)
- A1C target: Below 7.0% (53 mmol/mol) for most adults
- Less stringent A1C (elderly, comorbidities): Below 8.0% (64 mmol/mol)
- More stringent A1C (younger, short duration): Below 6.5% (48 mmol/mol) if achievable safely
Related Health Calculators
Blood glucose does not exist in isolation — it is part of a complex metabolic system. Use these complementary tools for a complete health assessment:
- BMI Calculator — Body mass index is strongly correlated with insulin resistance; higher BMI increases type 2 diabetes risk substantially
- Body Fat Calculator — Visceral fat (especially abdominal) is more metabolically active and dysregulating than subcutaneous fat
- Calorie Deficit Calculator — Moderate calorie restriction is one of the most effective interventions for improving insulin sensitivity
- Maintenance Calorie Calculator — Understanding TDEE helps you calibrate energy balance without under-eating (which can cause hypoglycemia)
- Harris-Benedict Calculator — Basal metabolic rate calculation essential for nutrition planning in diabetes management
- Height Calculator — Height is used in BMI calculation and drug dosing formulas relevant to diabetes medications